- This event has passed.
Storytelling with Data
January 16 @ 11:00 am - 12:30 pm
Free
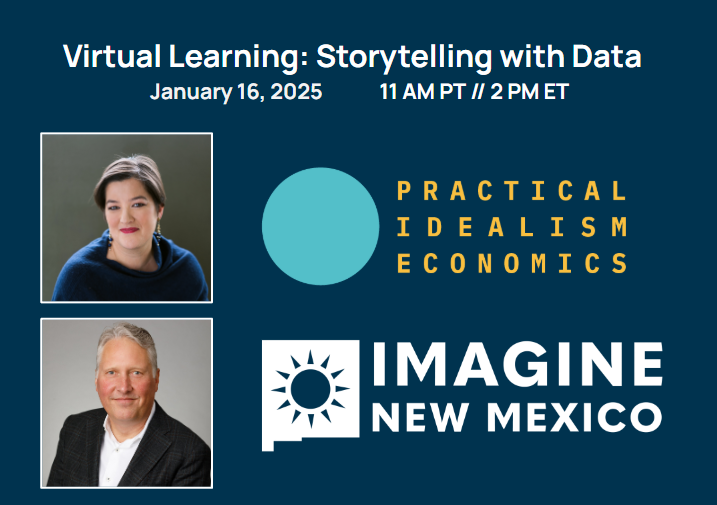
Join Irena Asmundson of Practical Idealism Economics and Mark Benak of Imagine New Mexico for an interactive session on how your organization can use storytelling and data in your work.
Imagine New Mexico is a new non-profit fostering accountability and cooperation amongst local nonprofits, starting with improving health outcomes for New Mexico residents. In this session, we will explore a framework for applying narrative principles to data and how this approach can be used with Imagine New Mexico’s new health outcomes data dashboard. Please come prepared to help us brainstorm and offer feedback!
BONUS OFFICE HOURS: Participants can stay on for an additional 30 minutes of office hours with Irena, former Chief Economist for the state of California to ask questions about how to apply the framework to work in their own states!
To prepare for this session, please read the below and follow the listed next steps:
Stories help us make sense of data, and if you are not explicit about communicating one, the public will insert their own.
A story is defined by:
- People who
- Are trying to do something, but
- Are blocked for some reason.
We already implicitly have these in mind, just because we’re human. When we decide to engage in non-partisan, data-driven research, this is almost certainly because there is a problem we want to help solve to help people.
When we put out research and data dashboards, we might define everything except what actually is the solution. By choosing what data to highlight, we are showing who we care about, what is going on with them now, and in defining the problem (such as by picking comparators) we are implicitly defining the problem and what success looks like. At least, that’s what the
public will conclude when looking at your work. Be honest with yourself: decide on the story elements and deliberately show the public what you’re thinking. Tell people why a dataset it important, or what you are concluding from it. They might disagree, but at least you will be clear with each other and can have a dialogue based on data.
Next steps:
1. Take the quiz: https://pi-economics.com/quiz
2. Map out your story elements.
3. Check how your work aligns with the story.
4. Adjust how you highlight or explain your data/research.
5. Talk to the public about what makes sense to them, and
6. Iterate!
