Preparing for the Big Shift: our July Virtual Community Discussion

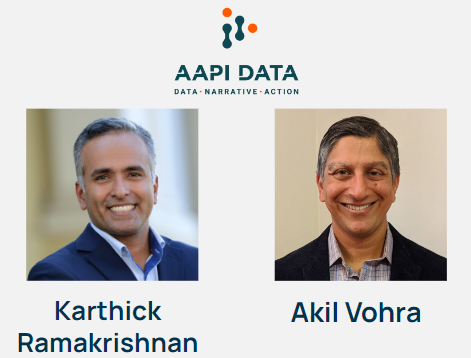
This month, we welcomed Karthick Ramakrishnan and Akil Vohra from AAPI Data to discuss Statistical Policy Directive No. 15, the latest set of federal standards for maintaining, collecting, and presenting data on race and ethnicity.

AAPI Data began the discussion with the case for the need for disaggregated data, and gave examples of how outcome disparities between the subgroups contained within the term “Asian American and Native Hawaiian Pacific Islander” can only be understood when the data is presented on the appropriate level. Karthick and Akhil also provided a glimpse into how they inspire action from policy makers by engaging their curiosity through a quiz that tested attendees.

In the discussion portion of the session, attendees were curious about protecting the utility of data when disaggregating, stakeholder engagement, and the pros and cons of representing diverse peoples in a single group.

The key takeaways from this discussion are:

  • Disaggregated data is a must for understanding the issues: Aggregated data can obscure the experiences of subpopulations and hide the need for policy change, while disaggregated data can reveal the impact of current policy or social factors. For example, it has been widely reported that Asian American populations experienced less COVID deaths per capita compared to other ethnic groups in the US. However, data by disaggregated by ethnicity shows that some AANHPI populations were disportionately impacted by the virus. 
  • Data alone isn’t enough: AAPI Data’s three pillars are Data, Narrative, and Action. Narrative is what makes the data feel “real” and helps move the policy process forward to “Action.” AAPI Data shares the narratives of its community through its recommendations and press-ready  reports.
  • Engage curiosity to inspire action: AAPI Data presents data to stakeholders through traditional means such as reports and charts, but will also use playful methods such as quizzes to grab legislators’ attention. This inspires policy makers to learn more, and ultimately understand the need for change.
  • Be part of the change to be well positioned for future work: If you can be part of the change at the state level, you can advocate for the data your organization needs and build relationships with key stakeholders for other projects. AAPI Data has campaigned for many years for the need for disaggregated data, and are starting to see change in data collection standards through Statistical Policy Directive No. 15. The result will be huge swaths of data that was previously unavailable, further enabling AAPI Data’s work. 

To review AAPI Data’s presentation slides, please click here. A recording of the presentation portion of the session is viewable here.

Creating & Launching the North Carolina Resilience Index – our June Virtual Community Discussion

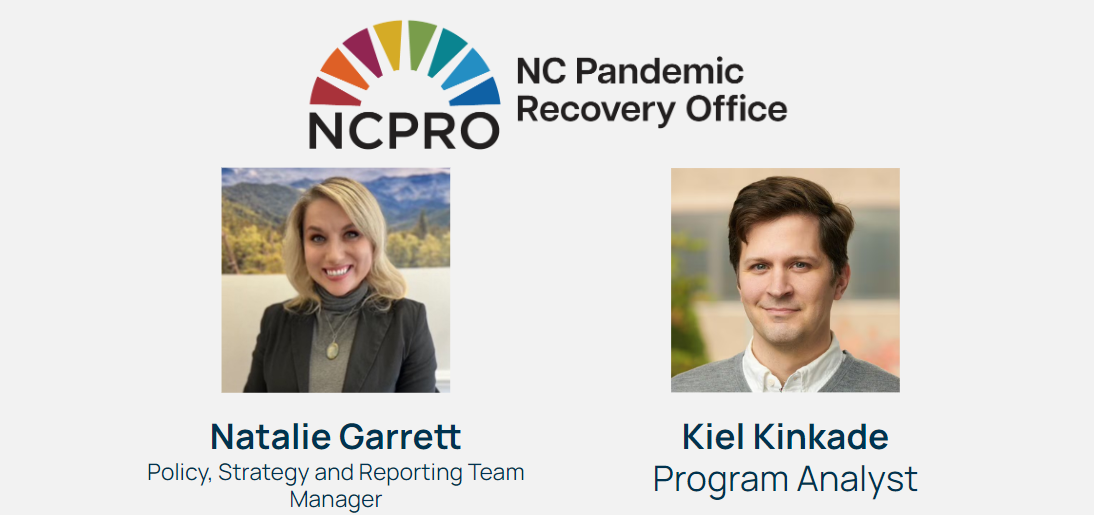
On June 20, 2024 our colleagues at the North Carolina Pandemic Recovery Office (NCPRO) shared their forthcoming tool, the Resilience Index and accompanying dashboard. Natalie Garrett and Kiel Kinkade discussed the challenges their community faced after the pandemic, and the data needed to understand the key issues faced by their community.

During community discussion. attendees were curious about the adoption strategy for the tool, how NCPRO approached communicating about the data sources used to make the Index, and stakeholder management on the scale that the Index required. Key takeaways from the session include: 

  • The problem your data tool is solving is your north star: Use cases are the foundation from which all decisions related to your tool’s features, data, and design should be made. The Resilience Index was built in direct response to a lack of data necessary for local decision makers to fully understand key social, economic, and environmental issues in their communities.
  • Build data tools with your audience in mind: NCRPO learned what their key users wanted from their index and prioritized those features to their roadmap to build buy-in on the tool and adoption. An example feature in the Resilience Index allows users to parse the data in different views that reflect their interests, such as county or council of government.
  • Educate stakeholders about the considerations, strengths, and limitations of your data product to create the right expectations and usage: NCPRO has created multiple versions of documentation to provide to users based on their familiarity with or desire for details on the statistics behind their indices.
  • Build with what you have, with the plan to improve over time: Sometimes the data that exists at the time of development is less than perfect, but you can always plan to improve sources in the future.
  • Collaborative design can build trust: The process of developing a useful data product in close collaboration with decision makers and/or funders can build trust and relationships. Even if you are a newer organization, doing this well can help stakeholders  see you as a responsible partner capable of becoming a trusted source of information.

Slides from this session are accessible here. If you prefer a recording of the presentation portion of this virtual community discussion, you may view one here.

Analyzing and Communicating About State Budgets – May 2024 Virtual Community Discussion

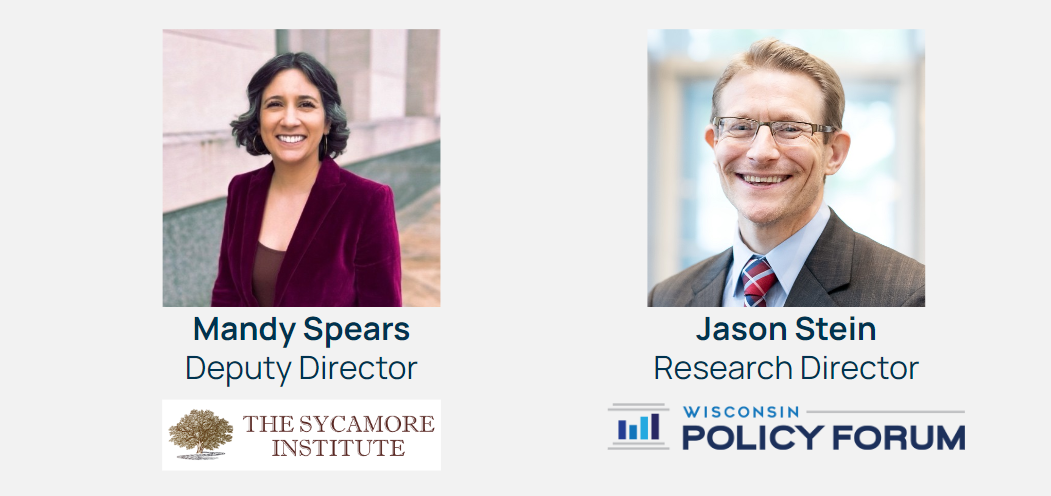
Our May Virtual Community Discussion spotlighted how two data-driven policy organizations analyze and communicate about their respective state budgets. To kick off the session, our speakers, Mandy Spears of The Sycamore Institute and Jason Stein of Wisconsin Policy Forum, shared the many ways their organizations engage in budget analysis. Though both the Sycamore Institute and Wisconsin Policy Forum create different types of reports and analysis, they share the approach of “zooming out” to provide context and implications of their state’s budget.

The Sycamore Institute achieves this through publishing deeper dives on bigger initiatives, mid-fiscal year trackers and budget recommendations, and a “primer” (a textbook on the budget) every gubernatorial election.

Wisconsin Policy Forum publishes reports that compliment the exhaustive analysis that similar organizations in their state produces, and focuses on interpreting the implications of their state’s budget on “big ticket” line items through visuals and simple language.

Key Takeaways:

  • Creating fair, non-partisan budget analysis builds trust with policymakers and the public alike, and can get your organization invited into new conversations. Offering budget analysis that is both helpful to and at times critical of both sides of the aisle builds trust in your organization and a reputation for being truly non partisan. This helps maintain your organization’s influence regardless of who is in office. In other words, don’t be afraid to ruffle feathers on both sides of the aisle.
  • Compelling storytelling and visuals are the most effective means of communicating with stakeholders. Providing just the numbers of the budget will not create the impact your organization is looking for – instead take your audience by the hand and explain what the budget means, and the implications that policy makers can learn from and use in their own efforts.
  • Tailor your organization’s budget work around what is already available in your state. Creating work that is duplicative to what is already available will not help you make an impact. Instead, offer analysis that is unique. For example, if another organization in your state writes comprehensive budget analysis, try creating complementary work that translates the key facts into shorter and/or more accessible language.
  • If you want to get involved with budget work, you can start small. Most of a state’s budget dollars are allocated toward just a few major budget categories. You can focus on just those few items to cover most of your state’s budget, and may spare you from engaging in policy areas your organization doesn’t otherwise wish to tackle.

Slides from the virtual community discussion may be viewed here. To view a recording of the presentation portion of the VCD, please use this link.

Using the States for the Future Data Platform – April 2024 Virtual Community Discussion

This month, our Virtual Community Discussion explored how data-driven policy organizations can use the States for the Future data platform. Speakers Dr. Holly Heard of Texas 2036 and Dr. David McClendon of January Advisors, both of whom were instrumental in all phases of building our platform, highlighted new features and data, including four new indicator areas launched this month! (Infrastructure, Government Performance, Natural Resources, and Justice and Safety)

Our discussion began with Holly and David providing background on how the indicators were selected and explaining the key ways that data-driven organizations can leverage the SFF data platform in their work:

  1. Serving as a trusted data source that offers vetted, up-to-date data that can generate summary visualizations, downloadable tables, or linked via API to power your own tools.
  2. Providing context and comparison to illustrate not just trends in your state but how they compare with other states and the nation as a whole. This includes multiple ways to disaggregate the data. 
  3. Connecting with peers using the organization profile feature to find others who are focused on the same policy areas and may be able to advise, brainstorm, or partner with.
  4. Act as a launchpad for prototyping your own tool – select indicators you want to display and share with partners or funders via the Organization Profile URL OR use the API as a reliable data source as you develop and launch your own tool

Followed by a tour of the platform, attendees saw how to use the indicator explorer, access the API, and create their own organizational profile

For the last 30 minutes of our discussion, attendees asked questions of Holly and David and each other. Three main lines of inquiry emerged during the conversation:

  • What skills are needed to create a data tool? What is the right balance between in-house and vendor or researcher expertise?
  • How can these types of platforms support smaller organizations or government entities with the time consuming work of wrangling and maintaining data?
  • Can data tools generate enough revenue for organizations, like nonprofits, to self-sustain or partially sustain themselves? How do funder priorities impact the development of a data product? How can we sustain the States for the Future data platform? Should certain features be gated through a log-in or have a cost to access? 

Many of these topics are covered more in-depth in our newest network resource, Building Quality Data Products. Please contact the SFF team at info@statesforthefuture.org if you are looking for thought partnership in building your own data product!

Thank you to all the new and familiar faces who joined this month’s virtual community discussion and shared their knowledge, thoughts, and comments. It was wonderful to reunite with many after our in-person convening in Tempe! 

You can access the materials from this virtual community discussion here:

Virtual Learning Series: Polling & How to Get Started

How can we ensure the policy conversations happening in our state reflect the priorities of our communities? 

Join States for the Future and the Center for the Future of Arizona for a discussion on the use of polling to understand the priorities of our states’ residents. Attendees will learn about “The Arizona We Want” poll and how Center for the Future of Arizona has used polling data to engage communities and decision makers around a shared vision for Arizona’s future.

Slides for this session, including key takeaways are now available. A recording of the session content can be viewed using this link.

Presenter: 
Dr. Amanda Burke is the Executive Vice President of the Center for the Future of Arizona. Dr. Burke focuses on innovation and systemic change that will advance the priorities of Arizonans and the long-term future success of the state. She is responsible for the organization’s strategy, operations, and program leadership, including CFA’s statewide initiatives in the areas of education, workforce, and civic engagement. Amanda is a Senior Advisor to the States for the Future network.

About Center for the Future of Arizona:
Center for the Future of Arizona (CFA) is a nonprofit, nonpartisan organization that brings Arizonans together to create a stronger and brighter future for their state. Born from a love for Arizona and a desire to help their state succeed, CFA invests time and resources into the state and its people, including a unique partnership with the Gallup organization to build robust survey research of Arizonans to bring critical issues to public attention, and work with communities and leaders to solve public problems.

CFA offers many resources, such as its Arizona Progress Meter, a web-based tool with interactive data and downloadable charts.

Virtual Learning Series: Using Rankings & Indicators with the Common Sense Institute

Want to learn how you can inspire policy conversations in your state with rankings and reports? Then join us at our January virtual learning opportunity: Using Rankings & Reports to Drive Policy Discussions in Your State.

In this virtual learning session, participants will learn about the process of developing an index that allows us to rank and compare our state’s performance to other states and how these rankings can be used to inspire, facilitate, and frame policy conversations. We will be joined by Chris Brown, VP of Policy & Research at the Common Sense Institute, who will talk about his organization’s  recently released annual Free Enterprise Report and Competitiveness Indices. Chris leads the research efforts of CSI to provide insightful, accurate and actionable information on the implications of public policy issues throughout the state of Colorado.

The Common Sense Institute was founded in 2010 to champion Colorado’s economy and to be an educational resource for Coloradans, providing rigorous research on the impact of policies, initiatives, and laws that ultimately shape their lives. CSI’s mission is to provide Coloradans with the resources they need to make informed decisions about the future of their families and the state by helping to ground policy discussions with sound fiscal and economic research. The Common Sense Institute has since opened offices in Arizona and most recently Iowa and Oregon.

Since 2022, the Colorado Common Sense Institute has published three Free Enterprise Reports, which are designed to inspire positive change in the lives of Coloradans. In this webinar, we’ll hear from Chris how exactly they’ve designed the report to support policy-makers and voters alike, what they’ve learned over time, and how they envision using reports to further their vision for their state.

Registration is now closed. Slides from this webinar (including key takeaways) are now viewable here and a recording of the session is accessible here.

Virtual Learning Series: Data Deep Dive – Education

What north star indicators are states using to drive collective action toward improving education outcomes?

How are non-partisan organizations using data to engage in education policy conversations?

How can the States for the Future Data Platform help you get started with exploring education data in your state?

Learn how to bring data into education policy conversations in States for the Future’s second virtual learning session, an Education Data Deep Dive. This will be an opportunity to discuss how to navigate education policy issues in your state alongside other nonpartisan organizations.

MyFutureNC’s Cecilia Holden will discuss their success using North Star metrics to drive action in North Carolina and Dr. Holly Heard of Texas2036 will highlight how States for the Future’s education indicators can provide the data you need to make an impact in your state.

This will be an interactive discussion, so please come with your own questions and experiences to share with the rest of the States for the Future network.

Registration is now closed. Slides (including key takeaways) are viewable here and a recording is accessible here.

Virtual Learning Series: Engaging Stakeholders to Build the Washington Vitals

How can you use data to drive ongoing conversations about your community’s future?

The Washington Vitals offer the most current data at the state and community levels to track progress toward Washington State’s desired future. Together with business and community partners, AWB Institute made Washington’s data come to life through good design and ongoing collaboration around the data.

Join Erika Borg of the AWB Institute to learn more about Washington’s approach and discuss efforts in your own state.

Registration is now closed. Slides (including key takeaways) are viewable here.

Speaker:

Erika Borg has nearly 20 years experience working within philanthropic, nonprofit and corporate circles to improve the lives of young people.  In 2018 she started Civic Allies Consulting which supports chambers of commerce, nonprofits and philanthropy in drawing up strategy, programmatic design and identifying funding.  

Erika also serves as the Senior Advisor to AWB Institute, a 501c3 affiliated with the Washington State Chamber of Commerce, dedicated to the long-term economic success of all Washingtonians.  AWB Institute uses data and long-term economic trends to think through some of the biggest challenges facing Washington.  The Institute’s flagship project is Washington in the Making and “The Vitals”.  Erika has a Masters of Public Administration from University of Southern California and a Bachelors Degree in English from University of California, Davis.