Storytelling with Data: our January virtual learning opportunity

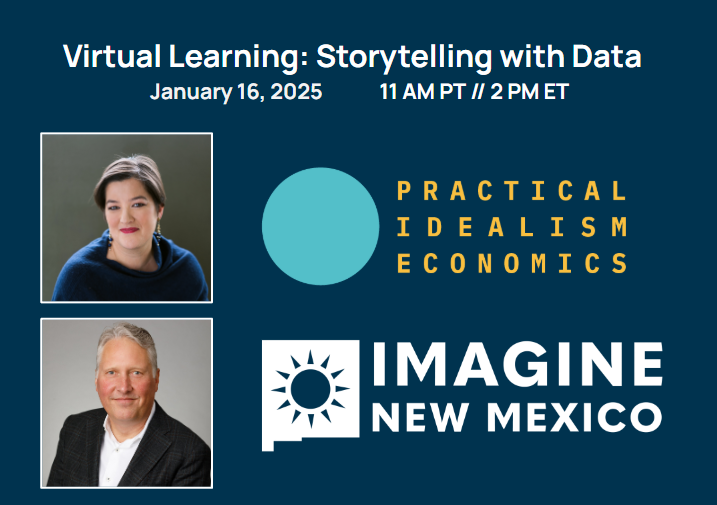
This month, Irena Asmundson from Practical Idealism Economics and Mark Benak from Imagine New Mexico partnered to host our January virtual learning opportunity. This session featured a new format that was a first for our network wherein Irena and Mark Benak hosted a live consulting session, exploring how to leverage data and storytelling to advance the mission of the newly formed organization. Through spectating and participating in the session, attendees saw how to apply storytelling best practices to their own work.

Key takeaways from this session:

  • Storytelling can offer a common, data-based starting point: When a political or ideological divide makes it difficult to talk to each other, storytelling with data can bring us back to our shared problems and options to build empathy across partisan divides.
  • Considering your audience is an essential part of creating your storytelling: Your organizational goals and KPIs are important, but when storytelling with data, considering your audience is equally important. Who will consume each artifact you publish? What is their familiarity with this issue? What are their motivations and goals? Tailoring your messaging to these considerations can maximize the impact of your story.
  • Data means more with context: Numbers alone may not indicate the scale, trend, or impact of an issue to your audience. Building narrative around your data can help your audience answer key questions like is this number big or small? Does it indicate a change from the past, or a direction we want to move in for the future? 
  • Presenting data requires a viewpoint, and transparency keeps it non-partisan: When policy organizations choose what data or indicators to track and publish, we are showing what issues and groups of people we focus on. When defining the problems in our communities, we are implicitly defining the problem and what success looks like. Being explicit and transparent helps us stay open to discussion, which is what makes it non-partisan.
  • Narratives can catalyze the audience: As a best practice, showing the audience how they can be the hero in the story can move them towards policy changes that improve the lives of your state’s residents. 

Slides from this session can be viewed here.

Have an idea for a learning opportunity that you would like to attend or host?
Please reach out to us at infor@statesforthefuture.org to explore further. 

Storytelling with Data

Join Irena Asmundson of Practical Idealism Economics and Mark Benak of Imagine New Mexico for an interactive session on how your organization can use storytelling and data in your work.

Imagine New Mexico is a new non-profit fostering accountability and cooperation amongst local nonprofits, starting with improving health outcomes for New Mexico residents. In this session, we will explore a framework for applying narrative principles to data and how this approach can be used with Imagine New Mexico’s new health outcomes data dashboard. Please come prepared to help us brainstorm and offer feedback!

BONUS OFFICE HOURS: Participants can stay on for an additional 30 minutes of office hours with Irena, former Chief Economist for the state of California to ask questions about how to apply the framework to work in their own states!


To prepare for this session, please read the below and follow the listed next steps:

Stories help us make sense of data, and if you are not explicit about communicating one, the public will insert their own.

A story is defined by:

  1. People who
  2. Are trying to do something, but
  3. Are blocked for some reason.

We already implicitly have these in mind, just because we’re human. When we decide to engage in non-partisan, data-driven research, this is almost certainly because there is a problem we want to help solve to help people.

When we put out research and data dashboards, we might define everything except what actually is the solution. By choosing what data to highlight, we are showing who we care about, what is going on with them now, and in defining the problem (such as by picking comparators) we are implicitly defining the problem and what success looks like. At least, that’s what the
public will conclude when looking at your work. Be honest with yourself: decide on the story elements and deliberately show the public what you’re thinking. Tell people why a dataset it important, or what you are concluding from it. They might disagree, but at least you will be clear with each other and can have a dialogue based on data.

Next steps:
1. Take the quiz: https://pi-economics.com/quiz
2. Map out your story elements.
3. Check how your work aligns with the story.
4. Adjust how you highlight or explain your data/research.
5. Talk to the public about what makes sense to them, and
6. Iterate!

Advocacy 101: our December virtual learning opportunity

By understanding the rules and leveraging available resources, nonprofits can confidently engage in meaningful activities that align with their missions. In our December virtual learning opportunity, we were joined by Bolder Advocacy, a program of the Alliance for Justice that empowers nonprofits and foundations to boldly advocate on behalf of their missions.

Bolder Advocacy’s senior counsel Tim Mooney shared with attendees the guidelines for lobbying and advocacy and what sort of activities 501(c)(3) organizations can engage in.

Key takeaways from this session were:

  • 501c3 organizations can engage in advocacy and lobbying: Advocacy does not have a legal definition and it can take many forms. Though restricted from partisan political activity, 501c3s may engage in advocacy such as training, litigation, and engaging with stakeholders. Lobbying, or trying to influence legislation, is allowed with certain restrictions.
  • Partisan advocacy or lobbying is always disallowed: Under the Internal Revenue Code, all section 501c3 organizations are prohibited from any political activity on behalf of or against any candidate for elective public office. Violating this rule may result in the revocation of tax-exempt status and certain excise taxes. 
  • Common exceptions to lobbying: Nonpartisan analysis, study, or research; Responding to requests for technical assistance; Self-defense; Examinations and discussions of broad social, economic, and similar problems; Op-Eds that aren’t supporting specific legislation or ballot measures.
  • Nonprofits are limited in how much lobbying they can engage in: As part of their tax treatments, the IRS limits how much lobbying a 501c3 can engage in. It tracks the the amount using one of two tests. The first, the “insubstantial part” test, is the “default” test and states that 501c3s must limit lobbying to an insubstantial part of their activities. The second test is the expenditure test, which offers an amount a nonprofit can spend on lobbying based on its annual expenditures. 
  • Bolder Advocacy recommends opting in to the 501(h) expenditure test: The IRS offers extremely clear guidelines for compliance in the expenditure test and there are less severe penalties for non-compliance. In contrast, the insubstantial part test does not offer specific guidelines (though some experts say up to 3-5% of your activities can be lobbying) and compliance requires some amount of guessing and risk tolerance. Nonprofits may opt into the expenditure using form 5768, which is quick and easy to fill out.
  • In addition to federal requirements, your state has policy on the lobbying activities of nonprofits: In order to remain compliant and not compromise your tax benefits, research your local requirements. Bolder Advocacy offers guides for each state on their website.

Additional resources from Bolder Advocacy:

If you would like to discuss how your organization can begin advancing your policy agenda through advocacy, please email us at info@statesforthefuture.org to set up a time.

Advocacy 101: Engaging in advocacy and lobbying as a 501(c)(3)

Join States for the Future and Bolder Advocacy on December 12th 10 AM PT / 1 PM ET for a primer on nonprofits and policy making. This session will provide comprehensive information on the rules governing policy — and election – related activity by 501(c)(3) organizations and how they can engage without jeopardizing their charitable status. Bring your questions and learn how your organization can participate in developing, implementing and evaluating policy solutions.

Bolder Advocacy is a program of the Alliance for Justice that empowers nonprofits and foundations to boldly advocate on behalf of their missions.

Thinking at scale: Our October 2024 Virtual Community Discussion

On October 17, States for the Future convened for a Virtual Community Discussion with Ten Across founder Wellington “Duke” Reiter. Ten Across is a cross-state organization dedicated to convening diverse perspectives to better share information and to inspire proactive decision-making for resilience and sustainability.

Many states, regardless of their political orientation, face comparable challenges, especially as the climate changes and the impacts are not confined by man-made state boundaries. In this session, Duke shared his organization’s experience with partnering with states in the southern US to address extreme heat and water management, and how other policy organizations can build coalitions, foster optimism, and collaborate with peer states to drive towards policy change.

Attendees discussed what communication tactics worked best for these often hyper-partisan issues and explored how representing new voices into the conversation. This can include customizing messaging based on the audience’s “issue and place,” and partnering with reputable organizations or influencers to shift a conversation.

Key takeaways from this session are:

  • Combining lived experiences with data can help individuals and decision makers picture themselves in the story:  10 Across looks at a wide range of complex issues facing municipalities and states along the Interstate 10 corridor in the southern US. They take  an  approach of “intersecting issue and place” and use storytelling and data to reflect the lived experiences of those in the region experiencing drought, storms, and increased demands on water management infrastructure. This approach can also reduce hyper-partisanship by humanizing the data. 
  • When communicating on controversial issues, recruit diverse voices: 10 Across has found that messages from the “expected” or “common” voices aren’t always effective with audiences, especially on issues like extreme heat and water management. Amplifying the voices of non-ideological experts that aren’t regularly prominent in a policy conversation may have more of an impact. For example, hearing from an Air Force Base Commander – a role that is typically viewed as neutral and non-partisan – on the threats of climate change can be an effective way to discuss what can be a politically divisive issue.
  • Offer a range of formats for storytelling: To reach their broad audience, 10 Across collaborates with media partners to create a variety of assets like  podcasts, videos, educational courses, data-rich maps and graphics, and events. This range of knowledge products creates traction with media and other organizations who can then use the assets in their own work or communications.

If you missed this session, a recording of Duke’s presentation is available here and slides may be accessed through this link.

Thinking at scale: States and cities collaborating on shared issues

Many states, regardless of their political orientation, face comparable challenges, especially as the climate changes and the impacts are not confined by man-made state boundaries.

Join us on October 17 for a conversation with Ten Across, a cross-state organization dedicated to convening diverse perspectives to better share information and to inspire proactive decision-making for resilience and sustainability. Ten Across founder, Duke Reiter, will share his organization’s experience with partnering with states in the southern US to address extreme heat and water management, and how other policy organizations can build coalition, foster optimism, and collaborate with peer states to drive towards policy change.

Preparing for the Big Shift: our July Virtual Community Discussion

This month, we welcomed Karthick Ramakrishnan and Akil Vohra from AAPI Data to discuss Statistical Policy Directive No. 15, the latest set of federal standards for maintaining, collecting, and presenting data on race and ethnicity.

AAPI Data began the discussion with the case for the need for disaggregated data, and gave examples of how outcome disparities between the subgroups contained within the term “Asian American and Native Hawaiian Pacific Islander” can only be understood when the data is presented on the appropriate level. Karthick and Akhil also provided a glimpse into how they inspire action from policy makers by engaging their curiosity through a quiz that tested attendees.

In the discussion portion of the session, attendees were curious about protecting the utility of data when disaggregating, stakeholder engagement, and the pros and cons of representing diverse peoples in a single group.

The key takeaways from this discussion are:

  • Disaggregated data is a must for understanding the issues: Aggregated data can obscure the experiences of subpopulations and hide the need for policy change, while disaggregated data can reveal the impact of current policy or social factors. For example, it has been widely reported that Asian American populations experienced less COVID deaths per capita compared to other ethnic groups in the US. However, data by disaggregated by ethnicity shows that some AANHPI populations were disportionately impacted by the virus. 
  • Data alone isn’t enough: AAPI Data’s three pillars are Data, Narrative, and Action. Narrative is what makes the data feel “real” and helps move the policy process forward to “Action.” AAPI Data shares the narratives of its community through its recommendations and press-ready  reports.
  • Engage curiosity to inspire action: AAPI Data presents data to stakeholders through traditional means such as reports and charts, but will also use playful methods such as quizzes to grab legislators’ attention. This inspires policy makers to learn more, and ultimately understand the need for change.
  • Be part of the change to be well positioned for future work: If you can be part of the change at the state level, you can advocate for the data your organization needs and build relationships with key stakeholders for other projects. AAPI Data has campaigned for many years for the need for disaggregated data, and are starting to see change in data collection standards through Statistical Policy Directive No. 15. The result will be huge swaths of data that was previously unavailable, further enabling AAPI Data’s work. 

To review AAPI Data’s presentation slides, please click here. A recording of the presentation portion of the session is viewable here.

Creating & Launching the North Carolina Resilience Index – our June Virtual Community Discussion

On June 20, 2024 our colleagues at the North Carolina Pandemic Recovery Office (NCPRO) shared their forthcoming tool, the Resilience Index and accompanying dashboard. Natalie Garrett and Kiel Kinkade discussed the challenges their community faced after the pandemic, and the data needed to understand the key issues faced by their community.

During community discussion. attendees were curious about the adoption strategy for the tool, how NCPRO approached communicating about the data sources used to make the Index, and stakeholder management on the scale that the Index required. Key takeaways from the session include: 

  • The problem your data tool is solving is your north star: Use cases are the foundation from which all decisions related to your tool’s features, data, and design should be made. The Resilience Index was built in direct response to a lack of data necessary for local decision makers to fully understand key social, economic, and environmental issues in their communities.
  • Build data tools with your audience in mind: NCRPO learned what their key users wanted from their index and prioritized those features to their roadmap to build buy-in on the tool and adoption. An example feature in the Resilience Index allows users to parse the data in different views that reflect their interests, such as county or council of government.
  • Educate stakeholders about the considerations, strengths, and limitations of your data product to create the right expectations and usage: NCPRO has created multiple versions of documentation to provide to users based on their familiarity with or desire for details on the statistics behind their indices.
  • Build with what you have, with the plan to improve over time: Sometimes the data that exists at the time of development is less than perfect, but you can always plan to improve sources in the future.
  • Collaborative design can build trust: The process of developing a useful data product in close collaboration with decision makers and/or funders can build trust and relationships. Even if you are a newer organization, doing this well can help stakeholders  see you as a responsible partner capable of becoming a trusted source of information.

Slides from this session are accessible here. If you prefer a recording of the presentation portion of this virtual community discussion, you may view one here.

Analyzing and Communicating About State Budgets – May 2024 Virtual Community Discussion

Our May Virtual Community Discussion spotlighted how two data-driven policy organizations analyze and communicate about their respective state budgets. To kick off the session, our speakers, Mandy Spears of The Sycamore Institute and Jason Stein of Wisconsin Policy Forum, shared the many ways their organizations engage in budget analysis. Though both the Sycamore Institute and Wisconsin Policy Forum create different types of reports and analysis, they share the approach of “zooming out” to provide context and implications of their state’s budget.

The Sycamore Institute achieves this through publishing deeper dives on bigger initiatives, mid-fiscal year trackers and budget recommendations, and a “primer” (a textbook on the budget) every gubernatorial election.

Wisconsin Policy Forum publishes reports that compliment the exhaustive analysis that similar organizations in their state produces, and focuses on interpreting the implications of their state’s budget on “big ticket” line items through visuals and simple language.

Key Takeaways:

  • Creating fair, non-partisan budget analysis builds trust with policymakers and the public alike, and can get your organization invited into new conversations. Offering budget analysis that is both helpful to and at times critical of both sides of the aisle builds trust in your organization and a reputation for being truly non partisan. This helps maintain your organization’s influence regardless of who is in office. In other words, don’t be afraid to ruffle feathers on both sides of the aisle.
  • Compelling storytelling and visuals are the most effective means of communicating with stakeholders. Providing just the numbers of the budget will not create the impact your organization is looking for – instead take your audience by the hand and explain what the budget means, and the implications that policy makers can learn from and use in their own efforts.
  • Tailor your organization’s budget work around what is already available in your state. Creating work that is duplicative to what is already available will not help you make an impact. Instead, offer analysis that is unique. For example, if another organization in your state writes comprehensive budget analysis, try creating complementary work that translates the key facts into shorter and/or more accessible language.
  • If you want to get involved with budget work, you can start small. Most of a state’s budget dollars are allocated toward just a few major budget categories. You can focus on just those few items to cover most of your state’s budget, and may spare you from engaging in policy areas your organization doesn’t otherwise wish to tackle.

Slides from the virtual community discussion may be viewed here. To view a recording of the presentation portion of the VCD, please use this link.

Using the States for the Future Data Platform – April 2024 Virtual Community Discussion

This month, our Virtual Community Discussion explored how data-driven policy organizations can use the States for the Future data platform. Speakers Dr. Holly Heard of Texas 2036 and Dr. David McClendon of January Advisors, both of whom were instrumental in all phases of building our platform, highlighted new features and data, including four new indicator areas launched this month! (Infrastructure, Government Performance, Natural Resources, and Justice and Safety)

Our discussion began with Holly and David providing background on how the indicators were selected and explaining the key ways that data-driven organizations can leverage the SFF data platform in their work:

  1. Serving as a trusted data source that offers vetted, up-to-date data that can generate summary visualizations, downloadable tables, or linked via API to power your own tools.
  2. Providing context and comparison to illustrate not just trends in your state but how they compare with other states and the nation as a whole. This includes multiple ways to disaggregate the data. 
  3. Connecting with peers using the organization profile feature to find others who are focused on the same policy areas and may be able to advise, brainstorm, or partner with.
  4. Act as a launchpad for prototyping your own tool – select indicators you want to display and share with partners or funders via the Organization Profile URL OR use the API as a reliable data source as you develop and launch your own tool

Followed by a tour of the platform, attendees saw how to use the indicator explorer, access the API, and create their own organizational profile

For the last 30 minutes of our discussion, attendees asked questions of Holly and David and each other. Three main lines of inquiry emerged during the conversation:

  • What skills are needed to create a data tool? What is the right balance between in-house and vendor or researcher expertise?
  • How can these types of platforms support smaller organizations or government entities with the time consuming work of wrangling and maintaining data?
  • Can data tools generate enough revenue for organizations, like nonprofits, to self-sustain or partially sustain themselves? How do funder priorities impact the development of a data product? How can we sustain the States for the Future data platform? Should certain features be gated through a log-in or have a cost to access? 

Many of these topics are covered more in-depth in our newest network resource, Building Quality Data Products. Please contact the SFF team at info@statesforthefuture.org if you are looking for thought partnership in building your own data product!

Thank you to all the new and familiar faces who joined this month’s virtual community discussion and shared their knowledge, thoughts, and comments. It was wonderful to reunite with many after our in-person convening in Tempe! 

You can access the materials from this virtual community discussion here: